|
Real Time Guest Satisfaction Dashboards Meld Behavioral and Motivational Insights for Gaming, Sports and Resort Marketers
|

We've often opined in this space, that the intersection of big data and traditional marketing research, can birth incredibly actionable insights. Several of our clients in the casino, resort, and sports property space have wisely invested in CRM systems that collect and output a vast array of customer behavior. Whether it's as simple as tracking RFM (
Recency of visitation,
Frequency of visitation,
Monetary spend/lifetime customer value) or more granular behavioral tracking through loyalty program smart cards or mobile apps, the leisure space has never before been as flush with behavioral data. With all of this information, these properties are able to understand how, when and where guests are spending their time while on property. Where this data falls short, is in uncovering the motivations and reactions at critical c
onsumer touch points, particularly where the guest comes into contact with key customer facing staff. An abundance of research has shown that these interactions often have greater impact on the
overall

guest experience and subsequent future visitation and
loyalty patterns.
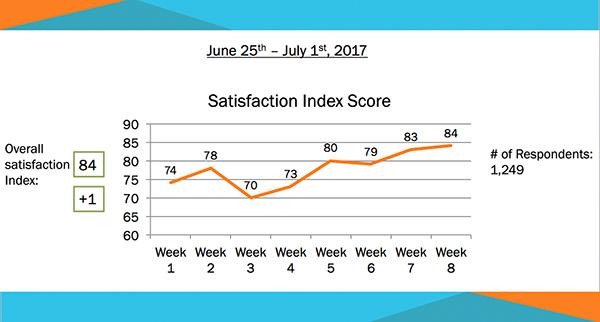
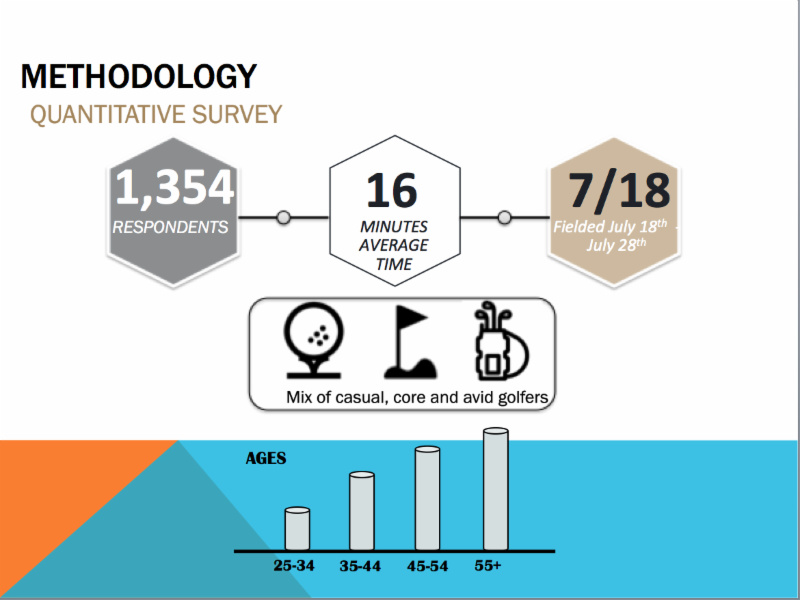
One way that SLRG has bridged this gap, is through the efficient deployment of both qualitative onsite intercept work and/or with short, near real-time satisfaction surveys, that are typically sent to guests or fans, within 24-72 hours of their visit. The online surveys are programmed with algorithms that pipe condition appropriate questions based on those different customer-facing moments that a guest experienced on property. SLRG then melds this data with the behavioral tracking captured and delivers customized and succinct insights in near-real time, through a proprietary online dashboard. These highly visual dashboards portray and normalize performance metrics for key operating areas, as well as for the property as a whole. Trends are analyzed and updated on the dashboard on a frequent (often weekly) basis. (see infographic below), allowing department leaders to efficiently track service gaps and recognize "star" performers.
For one casino client, the ability to review experience history and respond to specific high tier guests is achievable just a mere two clicks away from the dashboard home page, providing a relatively lower cost and low maintenance turn-key CRM solution relative to the abundance of high learning curve technology-based (rather than research based) solutions, now on the market. The ability to parse results by daypart or event date, ad
d
s to
property management's ability to identify specific staff strengths and weaknesses.
Integration of behavioral and attitudinal data helps marketers gain a better understanding
of how and why consumers are or aren't spending their time with your property and how different touch points affect their overall satisfaction and experience. Solutions are customizable and affordable. We can do this for you.
Contact SLRG today!
|
 |
|
|
SLRG Launches Insights Partnership with ASGCA
|
The American Society of Golf Course Architects leads their Ju
ne 2017 issue with highlights from SLRG's Survey of the American Golfer, conducted for Golf.com.
Click here to view the article.
 Concurrently, this marks the beginning of a partnership between SLRG and the ASGCA, as the association introduces a greater emphasis on providing their members and the golf industry with timely and actionable insights. Concurrently, this marks the beginning of a partnership between SLRG and the ASGCA, as the association introduces a greater emphasis on providing their members and the golf industry with timely and actionable insights.
Representing a diverse membership of leading golf facility designers, builders and other facility stakeholders, the ASGCA focuses on new course development, course renovation and design, preserving the game, its traditions and its community connections. The ASGCA proudly supports industry initiatives including "We are Golf" and "Get Golf Ready" and collaborates with allied organizations such as the USGA, National Golf Course Owners Association and PGA of America. We will be working with ASGCA members and constituents to provide a variety of insights and trends on contemporary issues impacting  golf course facility design, re-design, and renovation. Many readers of News and Views will receive an initial survey invitation, this week, with results and key findings to be presented at upcoming golf industry trade events, and highlighted in this newsletter and other golf media. golf course facility design, re-design, and renovation. Many readers of News and Views will receive an initial survey invitation, this week, with results and key findings to be presented at upcoming golf industry trade events, and highlighted in this newsletter and other golf media.
In the August Issue of the ASGCA's Insights, SLRG's report for the Arthur Little Family Foundation, titled "The Right Invitation for Women" was showcased. To download the report, and to learn more about our women's golf research, click here.
|
|
|
Recent Research of Interest
|
|
Qual/Quant Approach Goes Beyond Surveys to Provide Time and Cost Efficient Sports and Travel Industry Insights
|

We often have clients approach us with the desire to elicit target consumer reactions and demand for potential new products or services. In instances where these brands have the desire to uncover both emotional and motivational reactions as well as derive more than a directional sense of demand and price elasticity, the ideal methodological approach suggests initial qualitative (focus groups/depth interviews/observational research and concept testing) followed by a projectable market demand and pricing study. But in today's world of doing things quickly and within budget constraints, the luxury of such a process isn't always feasible. A customized approach that we've recently applied for multiple client engagements, blends the best of both modalities. Click here to read more.
|
|
Website Usability Testing Efficiently Measures Communications Efficacy
|
 Recent work with a resort client presented the challenge of eliciting projectible reactions to a website redesign from a large number of past guests across the country, without the luxury of face-to-face, directed exposure to the site. Recent work with a resort client presented the challenge of eliciting projectible reactions to a website redesign from a large number of past guests across the country, without the luxury of face-to-face, directed exposure to the site.
SLRG's customized approach created a forced exposure exercise that mirrored the new website's functionality directly into our online survey, so respondents could view the newly re-designed site, and navigate through specific elements that the client was particularly interested in assessing. By building the client's website into our survey framework, we were able to get the respondents immediate and curated response. We were also able to track and capture the specific digital platform (computer, tablet or mobile phone) that respondents were using for the survey, thus allowing us to gap analyze response variations and validate the efficacy of the new site's responsive design, which was particularly important for this client. Click to read more. |
|
|
|
|
Data Visualization and the Evolution of "Two Minute Take-Aways"
|
|
When we launched our firm, nearly a decade ago, an area of emphasis was to provide clients with research reports that included succinct up-front summaries of essential findings. Dubbed two-minute takeaways, these upfront slides, with quick bullet point summaries, remain a staple with many of our clients, particularly those who are less apt to engage in slides upon slides of data tables and charts. Of late, though, driven both by direct and implied client comments, and our own monitoring of best practices across related verticals like management consulting, we've become enamored with a heightened emphasis on info-graphics. And it appears to be with good reason.
A 2013, Microsoft report revealed that the average human attention span was just at eight seconds. Couple this with the fact that visuals and images are processed 60,000x faster than text, SLRG has begun to selectively evolve our two-minute takeaways into 20-second takeaways, with images and visuals or dashboards often replacing or supplementing the succinct bullet points that seemed all the rage, just a few years ago. That's not to say that we've willingly embraced what in some instances can be an unrealistic desire to oversimplify rather complex findings, but at our firm it has always been important for us to understand what the client's needs are and how the research is going to be used. This predicates the way in which we communicate our data, and increased client interest in the use of customized dashboards is a large part of that. The key for researchers and research clients, though, is to not use these 20-second takeaways as a shortcut, but to also look at the more rigorous analysis and data, from which broader insights can be derived. The ultimate solution for our clients is to combine both.
|
|
|
|
|
SLRG President Jon Last's June Media Post commentary, speaks to the disconnect between sports fans' elevated optimism and some of the amplified negative political tonality infiltrating sports coverage.
Read it here.
|
|
Optimizing Fan Experience: Lessons From An Afternoon Of 'Horsing Around'
A day at a thoroughbred track provides the inspiration for a fresh look at key elements for optimizing the fan experience, in the July Media Post Marketing: Sports. Click here to read it.
|
|
Marketing Sports: '17 Football Seasons & The Elephants In The Room
In his August 2017 Marketing: Sports, SLRG's Jon Last speaks to three key issues that those marketing in or around football, should be mindful of. Click here to read it.
|
Click here for archived issues of SLRG's "News & Views" e-newsletter, for all of the most up-to-date insight on issues impacting marketing research, the media, travel, sports and leisure industries.
|
|
|